AI-Powered Key Takeaways


Table of Contents

A mobile app does not have to crash to feel broken.
A screen that takes too long to open, a checkout button that responds a second late, a video that keeps buffering, or an app that becomes sluggish after several minutes of use can all turn into performance problems for the user.
What makes mobile app performance particularly difficult is that the same app can behave very differently depending on the device, operating system, available memory, network, location, and backend response. An app that feels fast on a developer's flagship phone over office Wi-Fi may struggle on an older device using a congested mobile network.
Improving mobile app performance, therefore, is not simply about making code execute faster. Teams need to understand what users experience, measure the right metrics, reproduce problems under realistic conditions, identify where delays originate, and prevent regressions as the application changes.
This guide explains how to improve app performance in 2026, from the metrics worth tracking to real-device and network testing, practical optimization techniques, and AI-assisted root cause analysis.
What Is App Performance?
App performance describes how quickly, smoothly, efficiently, and reliably an application responds while users interact with it.
Speed is part of the picture, but it is not the whole picture. A mobile application can launch quickly and still perform poorly if screens freeze during scrolling, network calls take too long, memory usage keeps increasing, or background activity drains the battery.
Mobile app performance generally includes:
- Startup performance: How quickly the app opens and becomes usable.
- Responsiveness: How quickly the app reacts to taps, gestures, navigation, and other inputs.
- Rendering performance: Whether scrolling, animations, and screen transitions remain smooth.
- Network performance: How efficiently the app sends and receives data.
- Resource efficiency: How the app uses CPU, memory, storage, and battery.
- Stability: How often the app crashes, freezes, hangs, or becomes unresponsive.
- Backend responsiveness: How quickly APIs, databases, and supporting services complete requests.
- Performance consistency: Whether the experience remains acceptable across devices, operating systems, networks, and locations.
The important word here is consistency. An average response time can look healthy while a particular device, region, or network is delivering a much slower experience.
That is why app performance should be measured across real user journeys rather than treated as a single speed score.
Why App Performance Matters
Performance affects almost every part of the mobile experience.
1. Users notice delays immediately
People may not know whether a delay came from an API, a blocked UI thread, an overloaded device, or poor network conditions. They only know that the app felt slow.
Repeated delays make routine actions harder. Opening the app, searching, adding something to a cart, making a payment, starting a video, or loading account information can all become points of frustration.
2. Performance affects reliability
High memory consumption, excessive background work, long-running operations, and blocked threads can eventually lead to hangs, crashes, or operating-system intervention.
On Android, user-perceived crash rate and ANR rate are Core Vitals. Google Play also defines bad-behavior thresholds for these metrics, meaning poor stability can have consequences beyond the individual session.
3. Device differences can expose hidden problems
A high-end smartphone may hide inefficient code because it has enough processing power and memory to compensate.
Move the same application to a lower-memory device, an older OS version, or a thermally constrained phone and the bottleneck may suddenly become obvious.
4. Network conditions change the experience
Mobile users move between Wi-Fi, cellular networks, weak coverage areas, and congested networks throughout the day.
If the app assumes consistently low latency and high bandwidth, real users will eventually find conditions where that assumption fails.
5. Every release can introduce regressions
Performance is not something teams optimize once.
A new SDK, larger image, API change, background service, analytics implementation, or UI redesign can make a previously fast workflow slower. Performance therefore needs to be measured continuously across builds.
Also Read: How to Improve Android App Performance?
The App Performance Metrics That Actually Matter
Teams can collect hundreds of measurements. The harder question is which ones deserve attention.
The best metrics connect directly to something the user experiences.
Android currently recommends measuring startup with metrics such as TTID and TTFD rather than looking at launch time as one undifferentiated number. It also recommends analyzing percentile performance, since averages can hide slower experiences affecting part of the user base.
The same principle applies to most performance metrics.
A payment API with a 500 ms average response could still be a problem if a meaningful percentage of requests take several seconds.
Track the median, but pay attention to higher percentiles such as P95 and P99 as well.
Also Read: Optimizing Mobile App Performance
How to Test App Performance Before It Reaches Users
Performance testing works best when it starts before the application reaches production.
A practical mobile performance testing process looks like this:
1. Identify critical user journeys
Start with actions users cannot afford to have fail or become slow.
Depending on the application, these could include:
- App launch
- Login and authentication
- Search
- Product browsing
- Checkout
- Payments
- File uploads
- Messaging
- Video or audio playback
- Booking
- Account management
Testing every screen equally can produce a large amount of data without telling you what matters most.
Prioritize journeys based on user importance and business impact.
2. Define a performance baseline
Run the journey under controlled conditions and record the important metrics.
For example:
- Startup time
- Screen load time
- API response time
- Memory consumption
- CPU utilization
- Network latency
- Errors
- Battery usage
The baseline gives future builds something meaningful to compare against.
3. Build a realistic test matrix
Include differences that can materially affect performance:
- Device model
- Device capability
- OS version
- Screen size
- Network type
- Network quality
- Geographic location
- App version
- Backend environment
You do not need every possible combination. Focus on configurations that represent meaningful portions of your user base and high-risk edge cases.
4. Run repeatable user journeys
Performance comparisons are much more useful when the same journey is repeated consistently.
Automation helps here because the exact flow can be executed across multiple devices and builds without introducing as much variation from manual interaction.
5. Compare results across builds
Do not wait for a release to feel slower.
Compare current performance against previous builds and established baselines.
Look for changes such as:
- Increased startup time
- Higher API latency
- Increased memory consumption
- New frame drops
- Higher battery usage
- Additional network calls
- New errors or crashes
6. Investigate the slowest experiences
An overall average can hide important outliers.
Segment results by device, OS, network, location, and build to understand where the experience changes.
A problem affecting one device family or mobile network may disappear completely when everything is combined into a global average.
7. Add performance checks to the release process
The earlier a regression appears in the development cycle, the easier it is to investigate.
Automated performance testing and regression checks can be integrated into CI/CD workflows so important journeys are evaluated as the application evolves.
Testing Under Real Network Conditions
A mobile application depends heavily on the network, yet performance testing is often conducted over stable office Wi-Fi.
That creates a blind spot.
Real users may experience:
- High latency
- Limited bandwidth
- Congested cellular networks
- Weak signal strength
- Packet loss
- Network transitions
- Regional routing differences
- Slow backend connections
- Unstable Wi-Fi
These conditions can expose problems that are difficult to reproduce in an ideal test environment.
Suppose a screen requires six API calls before it becomes usable. On a fast development network, each request may complete quickly enough that nobody notices.
Add latency, and those requests can compound into a visible delay.
Testing under different network conditions helps answer more useful questions:
- Does the application remain responsive when bandwidth drops?
- Do repeated requests occur when connectivity becomes unstable?
- How long does a transaction take on different networks?
- Are large assets delaying important content?
- Does the application retry requests efficiently?
- What happens when connectivity disappears halfway through a transaction?
- Does performance change by carrier or location?
Network performance should also be correlated with what appears on screen. Seeing that latency increased is useful. Knowing that the increase delayed the payment confirmation screen by three seconds is much more actionable.
Also Read: Mobile App Performance Testing Guide
Testing on Real Devices
Emulators and simulators remain valuable during development. They are quick to provision and useful for functional testing across different configurations.
Performance testing is different.
The physical characteristics of a device can directly influence results.
Real devices expose factors such as:
- Actual CPU performance
- Available memory
- Battery behavior
- Thermal throttling
- GPU and rendering characteristics
- OEM-specific Android implementations
- Real storage performance
- Real network radios
- Background applications and operating-system behavior
This becomes particularly important when testing older or mid-range devices.
A screen that renders smoothly on a flagship phone may stutter on a device with less memory and processing power. Memory-heavy workflows may work perfectly during a short emulator session but degrade during longer sessions on physical hardware.
The most useful approach is not to choose between emulators and real devices.
Use emulators and simulators for fast development feedback, then validate performance-critical workflows on representative real devices before release.
12 Ways to Improve Mobile App Performance
Once testing identifies where performance is degrading, optimization becomes much more targeted.
Here are 12 practical ways to improve mobile app performance.
1. Reduce Work During App Startup
The startup path should contain only what is necessary to display the initial experience and make the application usable.
Avoid initializing every SDK, service, database, or background component before the first screen appears.
Move non-critical initialization until after startup where possible.
On Android, cold startup requires the most work because the operating system must create the application process and initialize the UI from scratch. Google therefore recommends optimizing with cold-start behavior in mind.
2. Keep Heavy Work Away From the Main Thread
The main thread handles user interactions and UI updates.
If expensive calculations, file operations, database queries, or network-related work block it, the interface can freeze.
Move suitable work to background execution and keep the main thread available for immediate user interaction.
Apple recommends keeping synchronous main-thread work associated with discrete user interactions below roughly 100 ms to preserve responsiveness.
3. Reduce Unnecessary Network Requests
Every network request adds overhead.
Review critical journeys for:
- Duplicate requests
- Repeated API calls
- Redirect chains
- Requests for unused data
- Excessive polling
- Resources fetched individually when they could be combined
Do not optimize only the backend response time. Look at the entire journey from user action to visible result.
4. Reduce Network Payload Size
Large requests take longer to transfer, particularly when network conditions deteriorate.
Send only the data the app actually needs.
Depending on the workload, improvements can include:
- Compressing responses
- Reducing oversized JSON payloads
- Paginating large datasets
- Resizing images appropriately
- Avoiding unnecessary metadata
- Using efficient media formats
Smaller transfers can also reduce mobile data consumption.
5. Cache Frequently Used Data
Not every resource needs to be downloaded again.
Effective caching can reduce repeated network requests and make frequently accessed screens feel faster.
Static assets, previously retrieved data, thumbnails, and other reusable resources may all be good caching candidates.
The important part is defining sensible expiration and invalidation rules so improved speed does not come at the cost of stale information.
6. Optimize Images, Video, and Other Media
Media can quickly become one of the heaviest parts of an application.
Avoid loading a large high-resolution image when the interface displays it as a small thumbnail.
Consider:
- Serving images at appropriate dimensions
- Compressing media
- Using suitable modern formats
- Loading thumbnails before full-resolution assets
- Streaming media instead of downloading it completely
- Avoiding unnecessary autoplay
- Caching reusable content
Media performance should also be evaluated under slower networks, where inefficient asset delivery becomes much easier to spot.
7. Use Lazy Loading
Not everything has to load before a screen becomes useful.
Lazy loading postpones non-essential resources until they are actually required.
For example, a long product list might initially load visible content while retrieving additional items as the user scrolls.
This reduces startup work and helps prioritize resources the user needs immediately.
8. Control Memory Usage and Fix Leaks
Memory problems often build gradually.
An application can feel fine when it starts, then become slower after several screens have been opened if objects, images, listeners, or views are not released correctly.
Profile memory during longer journeys and repeated navigation.
Look for:
- Memory that continuously increases
- Large objects remaining in memory
- Unreleased views or activities
- Excessive bitmap usage
- Duplicate cached data
- Libraries consuming unexpected amounts of memory
Performance testing should therefore include longer sessions, not just quick smoke tests.
9. Monitor CPU and Battery Consumption
Performance optimization should not make the application unnecessarily expensive to run.
Heavy computation, continuous location access, excessive wakeups, unnecessary background processing, animations, and frequent network activity can increase CPU usage and battery drain.
Profile these resources during realistic workflows.
A feature that performs correctly but noticeably drains the user's battery still has a performance problem.
10. Optimize Local Storage and Database Operations
Apps increasingly store meaningful amounts of data locally.
Large synchronous database queries, frequent disk access, poorly indexed queries, and unnecessary writes can slow the user experience.
Keep expensive storage operations away from the UI thread where appropriate, optimize queries, retrieve only required records, and avoid repeatedly writing data that has not changed.
11. Audit Third-Party SDKs
Analytics, advertising, messaging, authentication, observability, social, and payment SDKs can simplify development, but every dependency adds something to the application.
Review:
- Startup work performed by SDKs
- Network calls they generate
- Memory footprint
- CPU consumption
- Background processes
- Application size impact
Remove libraries that are no longer needed and delay non-critical initialization when possible.
12. Test Every Performance Change Against a Baseline
Optimization without measurement is guesswork.
Before making a change, capture the existing performance. After the change, repeat the same test under comparable conditions.
Then ask:
- Did startup improve?
- Did another metric become worse?
- Did memory consumption change?
- Did network traffic increase?
- Does the improvement hold across different devices?
- Does it still hold under slower networks?
The goal is not simply to make one benchmark faster. It is to improve the overall user experience without introducing a new bottleneck elsewhere.
AI-Driven Root Cause Analysis for Performance Issues
Modern applications produce a huge amount of performance data.
A single test session can contain application events, device metrics, network requests, logs, screenshots, video, errors, and timing information. The challenge is no longer just collecting the information. It is understanding which signals belong together.
This is where AI-assisted performance analysis can help.
Instead of asking engineers to manually inspect every metric independently, analysis systems can identify unusual behavior and correlate events occurring at the same point in a user journey.
For example, imagine a checkout screen takes significantly longer to load in a new build.
Several things may have happened at the same time:
- The user taps Pay.
- A network request begins.
- API response time increases.
- The UI remains on a loading state.
- Memory usage rises.
- The final confirmation screen appears several seconds later.
Looking at only the screen recording shows the delay.
Looking only at network logs shows a slow request.
Correlating the two helps explain what the user actually experienced and where investigation should begin.
AI-driven analysis can help teams:
- Detect unusual performance behavior
- Surface recurring bottlenecks
- Correlate app, device, and network signals
- Highlight the period where degradation occurred
- Compare behavior across test sessions
- Prioritize issues that have the greatest performance impact
- Reduce the amount of data engineers need to review manually
AI should support root cause analysis rather than replace it.
Developers still need enough evidence to confirm whether the underlying cause is application code, backend behavior, the network, device resource constraints, or another dependency.
Mobile App Performance Audit Checklist
Use this checklist when reviewing an existing mobile application or preparing a new release.
1. Startup and Responsiveness
- Measure cold, warm, and hot startup where relevant.
- Track TTID and TTFD for important startup scenarios.
- Check whether unnecessary work occurs during launch.
- Identify long-running tasks on the main thread.
- Test taps, navigation, scrolling, and animations for visible delays.
2. Network Performance
- Measure latency for important APIs.
- Identify duplicate or unnecessary requests.
- Check request and response payload sizes.
- Verify caching behavior.
- Test slow and unstable network conditions.
- Test temporary connectivity loss.
- Compare performance across relevant regions or networks.
3. Device Performance
- Measure CPU consumption.
- Monitor memory usage over extended sessions.
- Check for memory leaks.
- Measure battery impact during key journeys.
- Test lower-spec and older devices.
- Test representative Android and iOS versions.
- Check device-specific performance differences.
4. Rendering
- Test scrolling for dropped or delayed frames.
- Check animations and transitions.
- Identify expensive UI operations.
- Optimize large images and visual assets.
- Check rendering on different screen sizes and device classes.
5. Stability
- Track crashes.
- Monitor ANRs and hangs.
- Investigate app terminations caused by resource pressure.
- Test longer sessions, not just short workflows.
- Reproduce problems using the same device and network conditions where possible.
6. Release Testing
- Establish performance baselines for critical journeys.
- Compare performance build over build.
- Automate repeatable performance journeys.
- Include representative real devices.
- Include realistic network conditions.
- Review performance regressions before release.
- Continue monitoring after deployment.
How HeadSpin Helps Improve App Performance
HeadSpin helps teams test and analyze application performance on real devices and networks across 50+ global locations. Performance data can be captured across application, device, and network layers, with more than 130 performance KPIs available for analysis.
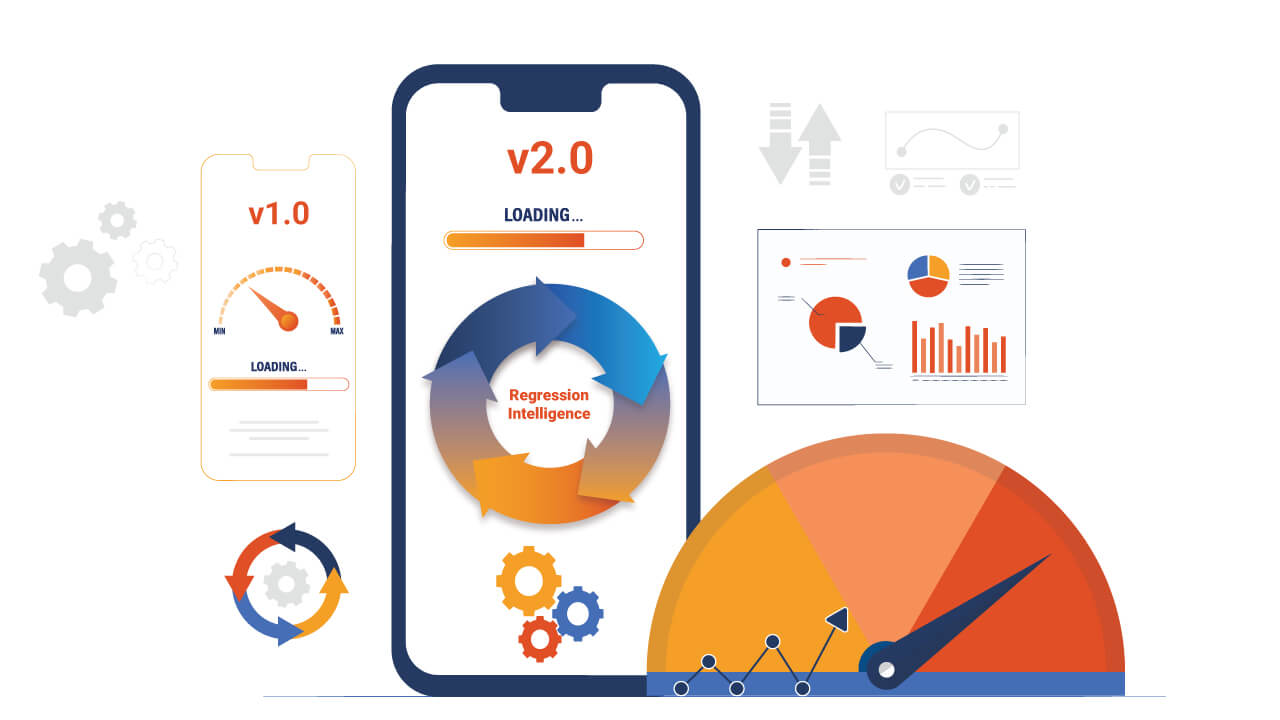
Teams can use the Waterfall UI and session recordings to correlate user actions with performance data, while AI-powered Issue Cards help surface issues such as latency, freezes, and other performance bottlenecks. Regression Intelligence can compare KPIs across builds, devices, locations, and test sessions to identify degradation before release.
This allows performance testing to become part of existing functional and automated testing workflows instead of being treated as a separate activity at the end of development.
Conclusion
Improving app performance starts with understanding exactly what users experience.
A fast backend does not guarantee a fast screen. A test that passes on one phone does not guarantee the same experience on another. And a build that performs well over office Wi-Fi may behave very differently on a real mobile network.
The most effective approach is continuous: measure critical journeys, test them across representative devices and networks, find the bottleneck, make a targeted change, and compare the result against a reliable baseline.
As mobile applications become more complex, performance engineering needs to move earlier in the development lifecycle as well. Real-device testing, network-aware testing, automated regression analysis, and AI-assisted diagnosis can give teams the evidence they need to find problems before users do.
Frequently Asked Questions
Q1. Should mobile performance testing use real devices or emulators?
Ans: Both have a place. Emulators and simulators provide fast feedback during development, but real devices are important for final performance validation because actual CPU, memory, battery, thermal behavior, rendering hardware, operating-system implementations, and network radios can affect results.
Q2. How does network speed affect app performance?
Ans: Mobile applications frequently depend on APIs and remotely hosted content. Higher latency, lower bandwidth, packet loss, or unstable connectivity can increase screen load times and make transactions feel slower. Network testing helps reveal whether the application remains responsive under these conditions.
Q3. Why does an app become slower over time?
Ans: Performance that deteriorates during a longer session can be caused by memory leaks, growing caches, unreleased objects, repeated background tasks, excessive network activity, database growth, or increasing resource consumption. Longer-duration testing can help reveal problems that short functional tests miss.